


Across Europe, and particularly in the Nordic region, observability has become a foundational capability for organisations operating distributed infrastructure and cloud-native applications. As a result, many enterprises are now evaluating Splunk alternatives in the Nordics that offer stronger cost control, deployment flexibility, and regulatory alignment. Reliability and performance teams increasingly rely on unified telemetry logs, metrics, and traces (LMT) to gain real-time insights into system behaviour, support service reliability, and support the broader evaluation of enterprise observability tools under evolving regulatory frameworks.
Splunk has long been a default choice for log analytics and monitoring. However, its ingestion-based pricing and declining innovation have driven many European organisations to evaluate alternatives to Splunk that better align with modern observability architectures, regional regulatory expectations, and changing observability pricing models. Industry analysis highlights several Splunk competitors that offer comparable or broader observability capabilities, with more flexible deployment models, stronger data residency options, and cost structures tailored to European requirements.
Below are five platforms frequently evaluated by European practitioners as viable Splunk alternatives in the Nordics.
Disclaimer: Please note that any time for PoC and/or implementation mentioned in the blog are practical market estimates and not vendor-promised commitments in most cases (unless explicitly specified otherwise), as there will be variations based on implementation/enterprise requirements
Dynatrace
Dynatrace is a good Splunk alternative for Nordic companies that want a unified observability platform that provides full-stack monitoring across their enterprise architecture. Additionally, this platform’s biggest advantage comes from its automation capabilities connecting data across the enterprise systems in way that helps teams identify likely root causes faster instead of forcing them to piece findings together manually.
Use Cases
Some common enterprise uses cases for Dynatrace include the following:
- Full-stack observability for complex cloud and hybrid estates
- APM for business-critical applications
- Digital experience monitoring
- Operations modernisation (root cause analysis etc.)
In this respect, Dynatrace has already proven its capabilities through several high profile use-cases, with notable examples being when Zurich North America reported a 30% reduction in observability operating costs and an 89% reduction in incidents after using Dynatrace during cloud migration, while HMCTS saw a reported a 70% reduction in mean time to resolution with Dynatrace’s AI root-cause analysis capabilities. These success stories reflect one clear value for businesses: less time spent chasing issues, fewer blind spots, and better operational control. This makes Dynatrace one of the more established Splunk competitors for large enterprises that value automation and operational depth.
With these promising use-cases in mind, Dynatrace can be viewed as the best fit for:
- Large enterprises
- Regulated organisations
- Hybrid or multi-cloud environments
- Teams managing many apps and dependencies
- Operations teams spending too much time on manual troubleshooting
To meet these business expectations, Dynatrace also presents users with a 15-day free trial and says teams can get started in under 5 minutes, but a meaningful enterprise PoC will usually take longer because real systems, teams, and workflows need to be assessed properly.
Support, Pricing and SLA
Dynatrace uses capability-based pricing instead of one fixed platform fee. Public pricing starts at $7 per host/month for Foundation and Discovery, $29 per host/month for Infrastructure Monitoring, and $58 per 8 GB host/month for Full-Stack Monitoring. That gives flexibility, but costs can rise as coverage expands.
Additionally, it also offers structured support through Standard and Enterprise Success and Support, with documented SLA differences and a customer success layer. This makes it an attractive option for enterprises that want strong vendor-led guidance in addition to platform access.
Pros
- Strong full-stack visibility
- Good automation and root cause analysis
- Works well for large, complex environments
- Strong enterprise support options
Cons
- Can be expensive at scale
- May feel heavy for smaller teams
- Pricing can get complex
Datadog
Datadog is a good option for buyers who are ready to watch usage and cost closely as they scale. Its advantage lies in its speed of adoption and correlation across logs, metrics, traces, security, and infrastructure telemetry, which makes it a good Splunk alternative in the Nordics for cloud-first teams. Datadog also showcases a wide range of available integration options, especially across Kubernetes-heavy environments.
Use Cases
Popular use cases for Datadog include:
- Observability for modern application stacks
- Kubernetes and container monitoring
- Incident response workflows
- Standardising telemetry across engineering teams
A strong case that highlights Datadog’s capabilities more practically is that of Forbes, which used Datadog to expand observability access from 5 users to 88 users, thus constituting its entire tech team by the end of deployment.
Forbes’ story showcases how Datadog fits best when the enterprises want quick rollout and broad cloud observability without a heavy implementation model. Datadog therefore ideally suits:
- Cloud-first organisations
- SaaS and digital product businesses
- Fast-growing enterprises
- Teams with lean operations resources
- Businesses that want strong observability without managing much infrastructure themselves
For prospective industries, Datadog offers a free trial, which makes early hands-on testing straightforward. A more useful enterprise PoC will still take longer when real workloads, teams, and cost modelling are included, but the results are proven successes.
Support, Pricing and SLA
Datadog’s pricing is transparent, but it can expand quickly as more products are added. Public pricing lists Infrastructure Pro at $15 per host/month billed annually and Infrastructure Enterprise at $23 per host/month. Support is separate: Premier Support costs 8% of monthly spend with a $2,000 minimum and offers under 30-minute response for business-critical issues, 24×7. This means Datadog can be easy to start with, but buyers need to model long-term spend carefully.
As mentioned previously, Datadog’s tiered support plans include Premier support with explicit response times, and it has a formal services and enablement function for implementation and optimisation. This type of SLA gives enterprises a strong combination of both direct vendor support and advisory depth during rollout.
Pros
- Fast to deploy
- Very strong cloud and Kubernetes monitoring
- Large integrations ecosystem
- Easy for teams to start using
Cons
- Costs can rise quickly
- Pricing can be hard to predict
- Managing usage needs close attention
Grafana
Grafana represents a modular approach to observability built around the open-source “LGTM stack”: Loki (logs), Grafana (visualisation), Tempo (distributed tracing), and Mimir (long-term metrics storage). This openness is the platform’s biggest advantage, making it one of the more flexible alternatives to Splunk for businesses that want lower lock-in and stronger control over how observability is built.
Use Cases
Popular use cases for Grafana’s unique capabilities include:
- Infrastructure monitoring
- Synergising well with modern cloud and open-source setups
- Kubernetes observability
- Operations focused on chronological data analysis and management
- Full-stack observability built on open standards
A particularly glowing example of Grafana’s capabilities with is LATAM Airlines, which used Grafana Cloud for real-time observability to improve customer-facing digital experiences. This example matches those of other major industries, illustrating just how well Grafana spans observability use cases across large environments and diverse industries. For teams running an observability platform comparison, Grafana often enters the shortlist when openness and architectural control matter more than plug-and-play convenience.
This further proves that Grafana works best when businesses want observability without committing to a heavy enterprise platform from day one. In this regard, it suits:
- Cloud-native businesses
- Engineering-led organisations
- Teams already using open-source tooling
- Enterprises that want lower vendor lock-in
- Businesses that need observability but want more pricing control
- Enterprises that want to avoid being boxed into a rigid commercial model too early
For any interested prospects, Grafana Cloud in particular offers a free plan and a 14-day trial path for paid usage, so it is relatively easy to test. A more meaningful enterprise PoC will still take longer if the business wants to validate logs, metrics, traces, and workflows across a broader estate. However, unlike more integrated SaaS platforms, the LGTM stack typically requires additional engineering for ingestion pipelines, schema governance, and automation workflows.
In this regard, Grafana Cloud pricing is usage-based, with published rates across metrics, logs, traces, Kubernetes monitoring, and application observability. Grafana also offers Free, Pro, and Enterprise plans, which makes it relatively transparent for buyers comparing entry cost versus scale cost.
Support, Pricing and SLA
Grafana’s commercial model follows a simplified structure. Grafana Cloud Pro starts at a $19 monthly platform fee and includes usage-based pricing beyond included limits plus 8×5 email support. Its Enterprise plan starts at a $25,000 annual commit and adds premium support, an Observability Architect, and broader deployment flexibility. This pricing structure makes Grafana a good choice for buyers who want to start smaller and expand more gradually.
The trade-off, however, is clear: quick start, but more engineering work if you want a heavily tailored stack. In terms of support services, Grafana Labs provides professional services for implementation, migration, training, and quick starts, and it offers technical support options tied to account type. It also has a partner ecosystem for buyers who want regional implementation help.
Pros
- Flexible and open
- Strong dashboards and visualisations
- Good fit for teams using open-source tools
- Works well for custom observability setups
Cons
- Needs more engineering effort
- May require more tool stitching
- Can take longer to operationalise fully
Elastic
Elastic specializes in holistic observability: bringing logs, metrics, traces, and security telemetry into one platform with strong querying, investigation, and reuse of data across observability and security workflows. A key architectural advantage of this platform is its search-driven analysis model, which makes Elastic especially relevant for organisations evaluating Splunk migration alternatives with more flexibility and stronger control over telemetry.
Use Cases
Common enterprise use cases for Elastic include:
- Log analytics
- Full-stack observability
- Infrastructure monitoring
- APM management
- Security analytics
Elastic integrates closely with OpenTelemetry, which supports a more vendor-neutral architecture and strengthens its relevance in any discussions involving modern enterprise observability tools. This vendor-neutral approach allows organisations to instrument systems once while maintaining flexibility in backend platforms at reduced expenditure, especially following platform migrations. One example of this is in the case of Equinox, who Elastic helped reduced observability operating spend by 80% for after moving from another platform.
With successful platform deployments like this in mind, Elastic operates best when businesses want observability with more flexibility and stronger control over data. This in turn best suits:
- Enterprises with large log volumes
- Hybrid or multi-cloud environments
- Teams that want logs, metrics, and traces in one platform
- Businesses that want stronger search and investigation workflows
- Buyers looking to reduce observability sprawl and retention trade-offs
- Environments where teams want one backend for multiple telemetry and detection use cases.
For prospective clients, Elastic offers a 14-day free trial and says teams can get started in about 5 minutes, so early testing is straightforward. A more useful enterprise PoC will still take longer once real production data, workflows, and stakeholder reviews are involved. Self-managed or multi-use-case rollouts can also contribute to the amount of time a PoC will take.
Support, Pricing and SLA
Elastic uses a resource-based pricing model rather than simple host-based pricing, which makes it relevant to any buying decisions around observability pricing models and long-term cost control. That gives enterprises more flexibility, but it also means cost planning depends on workload size, retention needs, and deployment model. On Elastic Cloud, Platinum and Enterprise tiers include a 99.95% monthly uptime SLA, which supports larger production use cases. This makes Elastic a good fit for buyers who want pricing tied more closely to architecture and usage, rather than a fixed observability package.
Elastic also offers formal support, training, and consulting. Its consulting materials highlight a sizeable global consulting bench, which matters for enterprise implementation and migration programs.
Pros
- Strong log analytics and search
- Good for combining observability and security
- Flexible deployment options
- Works well for data-heavy environments
Cons
- Needs stronger in-house skills or partner support
- Setup can take more planning
- Less plug-and-play than some SaaS-first tools
New Relic
New Relic is another widely used observability platform for enterprises that want broad observability, easier pricing, and a lower-friction path away from Splunk without losing enterprise relevance. The platform collects telemetry across logs, metrics, and traces while providing distributed tracing and performance monitoring for microservices environments, making it one of the more accessible log management alternatives to Splunk for software-driven teams. New Relic’s agents capture application-level telemetry across multiple programming languages and runtime environments.
Use Cases
Popular use-cases for New Relic offer a wide range of capabilities across the enterprise observability stack, including but not limited to:
- APM management
- Incident reduction,
- Cloud infrastructure visibility
- Digital experience monitoring
- Platform-wide observability rollout
- Uptime improvement,
- MTTR reduction
- Edge observability
- Cost reduction
Because of these capabilities, New Relic has a wide variety of uses-cases where it excels. A relevant and useful example is that of Viewpoint, which New Relic helped reduced spend by 57% with its all-in-one observability platform. Another is William Hill, which improved MTTR by 80% after leveraging New Relic’s platform capabilities.
What these use-cases prove is that New Relic fits best when the business wants full-stack observability without the heaviness or complexity of some higher-end enterprise platforms. Therefore, the platform is a good choice for:
- Mid-market and enterprise teams
- Businesses that want easier pricing logic
- Engineering teams that want broad visibility fast
- Organisations replacing older, more expensive monitoring setups
- Buyers who want to test value before scaling further
New Relic’s free tier includes 100 GB of free ingest per month, which makes early evaluation very accessible. A more serious PoC, however, still takes longer if the business wants to test across production workloads and multiple teams.
Support, Pricing and SLA
New Relic keeps pricing relatively simple, which helps its position amongst observability pricing models. As stated earlier, it includes 100 GB of free data ingest per month, then charges $0.40 per GB beyond that. It also states clearly that pricing is not per host. Support levels are also transparent: Standard includes 2 business day response for support, Pro includes 2-hour critical response, and Enterprise includes 1-hour critical response For business buyers, that level of clarity is a real advantage.
New Relic also has documented support-plan tiers for paid subscriptions and a formal professional services offering covering implementation, optimisation, training, and adoption support.
Pros
- Strong APM capabilities
- Easy to start with
- Broad platform access for teams
- Good fit for software-driven companies
Cons
- Costs still need monitoring
- Less known for deep infrastructure automation
- Can require tuning as usage grows
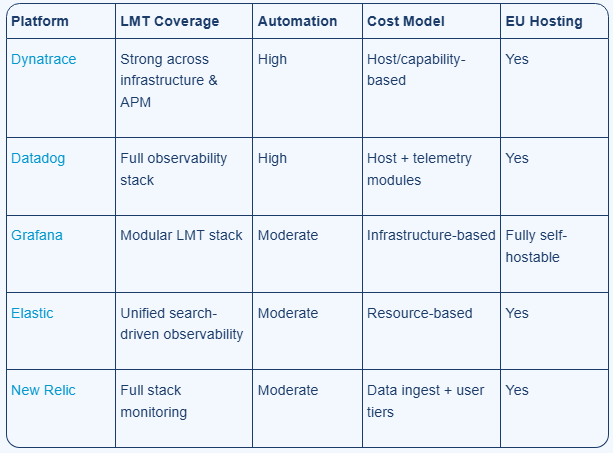
An Observability Platform Comparison: A Quick Recap for Nordic Buyers
For teams comparing the best Splunk alternatives, the decision usually comes down to telemetry coverage, automation depth, pricing structure, deployment model, and EU hosting requirements.
Platform
LMT Coverage
Automation
Cost Model
EU Hosting
For European organisations particularly in the Nordics observability platform decisions are shaped by infrastructure scale, regulatory requirements, and operational maturity. This is why many buyers exploring Splunk alternatives Europe also weigh data residency, pricing clarity, and platform flexibility more heavily than before.
Elastic, combined with operational expertise partners such as Observata and their Observability-as-a-Service offerings, provide a practical route for organisations evaluating Splunk migration alternatives with stronger control over architecture, operations, and long-term value.
While Elastic provides the underlying observability platform, Observata leverages its OaaS capabilities to support the design and implementation of automation workflows and operational governance. This helps it perfectly align with European best practices for large-scale environments and more mature adoption of enterprise observability tools.
If you are weighing cost, data residency, platform fit, and long-term operational control, Observata can help you assess whether Elastic is the right path for your environment and what the migration would actually involve.


")

