


If you build or operate software in Europe, you’ve probably noticed something: observability isn’t optional anymore – it’s essential for keeping the lights on. Whether you’re running fintech apps, supporting telco backbones, or keeping public services online, unified telemetry (logs, metrics, and traces) is now the norm for system reliability and insight. As a result, many teams are now evaluating Grafana alternatives in the Nordics that offer deeper analytics, automation, and end-to-end observability.
Grafana’s dashboards and open-source stack are its signature offering, providing clear and high-level insights for visualising metrics and tracing. But in 2026, enterprise observability tools are about more than just visualisation. Organisations need platforms that handle data end-to-end: ingest, analyse, and automate across large estates. In Europe and especially the Nordics data sovereignty and GDPR compliance are vital. Teams now weigh features alongside local hosting, transparent costs, and the quality of support after the contract is signed. This has led to a growing demand for alternatives to Grafana that can handle ingestion, analysis, and automation at scale.
We’ve seen these five alternatives come up most often in actual platform reviews and migrations across Europe. Here’s what stands out to practitioners evaluating Grafana competitors as part of a broader observability platform comparison.
Disclaimer: Please note that any time for PoC and/or implementation mentioned in the blog are practical market estimates and not vendor-promised commitments in most cases (unless explicitly specified otherwise), as there will be variations based on implementation/enterprise requirements
Dynatrace
Best for: Large enterprises with complex hybrid or multi-cloud environments.
Dynatrace does well where operational complexity is already high and teams want fewer moving parts in the stack. Dynatrace also supports structured enterprise support, which matters when observability is tied to critical operations. This makes it one of the stronger Grafana competitors for enterprises prioritising automation.
Use-Case: Basware used Dynatrace to create a single source of truth across its cloud-native environment, cutting manual problem analysis by 40% and reducing production defects by 12.5%.
POC and rollout: Trial access starts quickly. A focused enterprise PoC usually runs about 2 to 4 weeks, while broader rollout often lands in the 6 to 12 week range, depending on scope and governance. This timing is a practical market estimate, not a vendor commitment.
Pricing and support: Dynatrace uses capability-based pricing. Public pricing starts at $29 per host per month for Infrastructure Monitoring and $58 per 8 GiB host per month for Full-Stack Monitoring. Support includes Standard and Enterprise Success options.
EU fit: Dynatrace positions itself well for European buyers through its Trust Center and compliance posture, including GDPR-facing documentation and broader enterprise security controls.
Pros
- Strong full-stack visibility
- Good automation and root cause analysis
- Works well for large, complex environments
- Strong enterprise support options
Cons
- Can be expensive at scale
- May feel heavy for smaller teams
- Pricing can get complex
Datadog
Best for: Cloud-first businesses that want fast deployment and a polished SaaS experience.
Datadog greatly helps teams that want quick visibility across infrastructure, applications, logs, containers, and cloud services without managing much of the platform themselves. Its strength is speed, breadth of integrations, and ease of adoption. That makes it attractive for digital product companies, SaaS teams, and engineering organisations that want value fast.
Use-Case: PayPal chose Datadog for OpenTelemetry interoperability across its massive multi-cloud environment, giving teams 24/7 monitoring, real-time visibility, and faster time to insights while observing 70,000+ physical hosts, 400,000+ container hosts, and 200+ million metrics per minute.
POC and rollout: Datadog offers an easy trial path. In practice, a focused PoC often fits into 1 to 3 weeks, while broader enterprise rollout usually takes 4 to 10 weeks depending on agent rollout, tagging, and governance. This is a practical estimate rather than a formal vendor promise.
Pricing and support: Pricing is modular and product-based. Infrastructure Pro starts at $15 per host per month billed annually, while support tiers go up to Premier, priced at 8% of monthly spend with a $2,000 minimum. However, its modular pricing model highlights the importance of evaluating observability pricing models early.
EU fit: Datadog has an EU region in Germany and states that it supports customer GDPR compliance as a processor. This positions Datadog among EU-hosted observability platforms.
Pros
- Fast to deploy
- Very strong cloud and Kubernetes monitoring
- Large integrations ecosystem
- Easy for teams to start using
Cons
- Costs can rise quickly
- Pricing can be hard to predict
- Managing usage needs close attention
Splunk
Best for: Large enterprises with log-heavy operations and mature incident response needs.
Often considered one of the more mature Grafana competitors, Splunk is a good option for organisations that want strong machine-data analysis, large-scale log handling, and observability tied closely to resilience and operations. It is usually a better fit for enterprises already dealing with high telemetry volume, hybrid complexity, and broader security or IT operations programs.
Use-Case: Hyphen Group used Splunk Observability Cloud to unify metrics, logs, and traces, cut issue resolution from hours to minutes, and accelerate infrastructure deployment by 8x.
POC and rollout: Splunk offers a 14-day trial path. In practice, a focused PoC often takes 2 to 4 weeks and broader rollout 6 to 12 weeks, depending on instrumentation, dashboards, alerting, and governance. This is a practical market estimate.
Pricing and support: Splunk Observability Cloud starts at $15 per host per month for Infrastructure Monitoring, $60 for App and Infrastructure, and $75 for End-to-End, billed annually. It also provides support programs, success plans, and professional services for implementation and expansion.
EU fit: Splunk presents a credible enterprise compliance posture, including GDPR-facing privacy materials and security controls for its hosted observability services.
Pros
- Flexible and open
- Lower vendor lock-in
- Strong for cloud-native teams
- Good dashboarding and visualisation
- Easier to scale in phases
Cons
- Needs more engineering ownership
- Less packaged than enterprise SaaS tools
- Support is stronger on higher tiers
- Can feel fragmented for non-technical teams
- Setup can take longer in complex environments
Elastic
Best for: Enterprises that want one platform for logs, metrics, traces, and search, with more control over architecture and data use.
Elastic works well as a Grafana alternative when the goal is not just monitoring, but unified observability on a broader data platform. It is especially strong for log analytics, investigation workflows, OpenTelemetry observability strategies, and teams that want to reuse data across observability and security. It also suits Nordic buyers that care about deployment flexibility and long-term control.
Use-Case: The Swedish Public Employment Service used Elastic to unify observability, search, and APM across 60+ product teams, build around 400 dashboards, and cut APM license and storage costs by 75%
POC and rollout: Elastic offers a 14-day trial, so hands-on testing can start fast. A focused observability PoC often runs 2 to 4 weeks, while production rollout usually takes 6 to 12 weeks depending on pipeline design, access controls, and dashboarding. This timing is a market estimate.
Pricing and support: Elastic uses a resource-based model rather than a simple host fee. That gives more flexibility, but buyers need a clearer capacity plan up front. Support and subscription tiers are tied to deployment model and service level.
EU fit: Elastic has one of the stronger European stories in this group. It supports GDPR-focused deployment, lets customers choose provider and region, and is available across many cloud regions; making it one of the more flexible GDPR compliant observability tools in Europe.
Pros
- Strong log analytics and search
- Good for combining observability and security
- Flexible deployment options
- Works well for data-heavy environments
Cons
- Needs stronger in-house skills or partner support
- Setup can take more planning
- Less plug-and-play than some SaaS-first tools
New Relic
Best for: Software-driven organisations that want broad observability with a simpler commercial entry point.
As a practical cloud observability platform, New Relic is a good fit for product teams and engineering-led businesses that want APM, infrastructure visibility, and distributed tracing in one SaaS platform without a heavy setup model. Its commercial story is easier to understand than many enterprise tools, which helps buyers who want to test value before scaling usage.
Use-Case: Skyscanner used New Relic to achieve OpenTelemetry observability, replace 12+ monitoring tools, free up 10 experienced engineers from tool maintenance, and establish a default set of metrics, alerts, and dashboards across teams
POC and rollout: The free tier makes product access immediate. In practice, a PoC often fits into 1 to 3 weeks, while broader enterprise rollout usually takes 4 to 10 weeks depending on instrumentation and governance. This is a practical estimate, not a vendor commitment.
Pricing and support: New Relic includes 100 GB of free ingest per month, then charges beyond that based on usage. Support is tiered, with first-response targets of 2 business days for Standard, 2 hours for Pro, and 1 hour for Enterprise on P1 issues.
EU fit: New Relic documents privacy and data protection support for customers with GDPR and related data privacy requirements.
Pros
- Strong APM capabilities
- Easy to start with
- Broad platform access for teams
- Good fit for software-driven companies
Cons
- Costs still need monitoring
- Less known for deep infrastructure automation
- Can require tuning as usage grows
Observability Platform Comparison: A Quick Recap for Nordic Teams
For teams comparing Grafana alternatives, the decision often comes down to automation, cost structure, and deployment flexibility.
Platform
LMT Coverage
Automation
Cost Model
EU Hosting
Full-stack infrastructure and APM
High
Yes
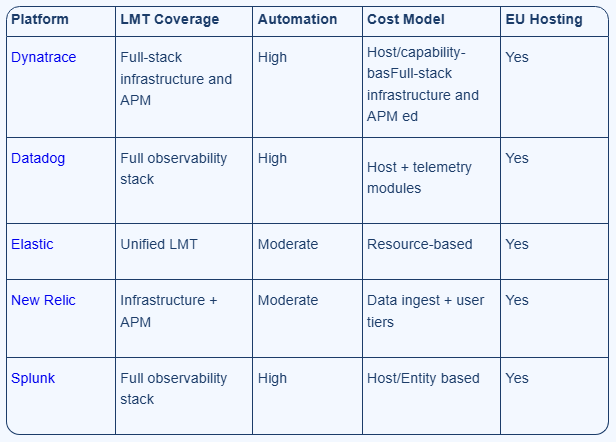
In Europe, and especially when evaluating Grafana alternatives in the Nordics, choosing an observability platform involves more than features. EU-hosted observability platforms, GDPR compliance, and long-term cost control all play a role.
As Nordic organisations look beyond dashboards, Elastic, backed by partners like Observata, stands out as a practical, reliable alternative. Elastic delivers robust observability, while Observata ensures your automation and governance succeed in real environments.
If you are evaluating Grafana alternatives in the Nordics and need clarity on cost, architecture, and long-term platform fit, Observata can help you assess whether Elastic is the right path for your environment and what the migration would actually involve


")

