


Observability has become a foundational capability for organizations operating modern, distributed systems. As applications move toward microservices, containers, and hybrid or multi-cloud environments, traditional monitoring approaches struggle to provide sufficient visibility. Observability goes beyond basic metrics and alerts by enabling teams to understand what is happening inside their systems through logs, metrics, traces, and contextual correlations.
Two platforms dominate conversations in this space: Splunk Observability and the Elastic Observability Stack. Both are powerful, enterprise-grade solutions, but they differ significantly in philosophy, architecture, cost structure, and flexibility.
This blog offers a deep comparison of Splunk and Elastic observability stacks, with a closer look at why Elastic often appeals to teams seeking openness and adaptability.
Quick Glance at Splunk vs Elastic
Here’s a simplified and cleaner table that keeps only the core points and makes the comparison easy to scan, with a slight preference toward Elastic and no bullet-style wording.
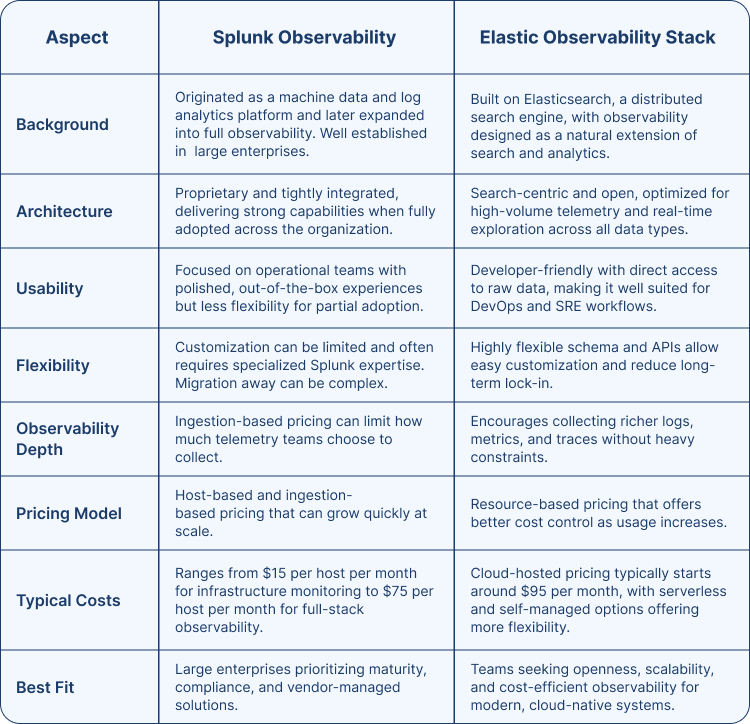
Aspect
Splunk Observability
Elastic Observability Stack
Background
Originated as a machine data and log analytics platform and later expanded into full observability. Well established in large enterprises.
Built on Elasticsearch, a distributed search engine, with observability designed as a natural extension of search and analytics.
Architecture
Proprietary and tightly integrated, delivering strong capabilities when fully adopted across the organization.
Search-centric and open, optimized for high-volume telemetry and real-time exploration across all data types.
Usability
Focused on operational teams with polished, out-of-the-box experiences but less flexibility for partial adoption.
Developer-friendly with direct access to raw data, making it well suited for DevOps and SRE workflows.
Flexibility
Customization can be limited and often requires specialized Splunk expertise. Migration away can be complex.
Highly flexible schema and APIs allow easy customization and reduce long-term lock-in.
Observability Depth
Ingestion-based pricing can limit how much telemetry teams choose to collect.
Encourages collecting richer logs, metrics, and traces without heavy constraints.
Pricing Model
Host-based and ingestion-based pricing that can grow quickly at scale.
Resource-based pricing that offers better cost control as usage increases.
Typical Costs
Ranges from $15 per host per month for infrastructure monitoring to $75 per host per month for full-stack observability.
Cloud-hosted pricing typically starts around $95 per month, with serverless and self-managed options offering more flexibility.
Best Fit
Large enterprises prioritizing maturity, compliance, and vendor-managed solutions.
Teams seeking openness, scalability, and cost-efficient observability for modern, cloud-native systems.
Splunk’s Enterprise-First Approach
Splunk built its reputation as a powerful machine data platform long before observability became mainstream term. Its observability stack evolved from log analytics into a broader suite that includes infrastructure monitoring, application performance monitoring, and real-time analytics. Splunk’s strength lies in its maturity and its deep penetration into large enterprises with complex compliance and governance requirements.
Splunk’s proprietary nature can restrict flexibility. Customization beyond supported patterns may require specialized expertise, and migrating away from Splunk can be challenging due to data formats and tooling dependencies.
Pros
- Splunk is extremely strong in security, compliance, and SIEM capabilities, making it a trusted choice for regulated enterprises.
- The platform delivers fast time-to-value with prebuilt dashboards and integrations.
- AI-driven alerting and anomaly detection help reduce noise and speed up incident response.
Cons
- Ingestion-based pricing becomes very expensive as data volumes grow.
- Data storage and tier management add operational complexity and hidden costs.
- Performance often requires expert tuning by experienced Splunk engineers.
- The platform is largely proprietary, leading to vendor lock-in.
Elastic’s Search-Centric Foundation
Elastic’s observability offering is built on the same core technology that powers Elasticsearch, which is fundamentally a distributed search and analytics engine. This architectural choice gives Elastic a natural advantage when it comes to high-volume telemetry data, real-time querying, and flexible schema design.
The Elastic Observability Stack unifies logs, metrics, traces, uptime monitoring, and user experience data in a single data store. Because everything is indexed and searchable in near real time, teams can pivot seamlessly between different data types without switching tools or contexts.
Elastic has consistently positioned itself as a developer-friendly platform. Its APIs, query language, and data model are approachable for engineers who want direct access to raw data. This makes Elastic particularly appealing to DevOps and SRE teams who prefer hands-on exploration over rigid dashboards.
Pros
- Elastic is significantly more cost-efficient at scale due to resource-based pricing.
- Native O-Tel support reduces vendor lock-in and future migration risk.
- Logs, metrics, traces, and security data live on a single unified platform.
- Tail-based sampling captures important traces while reducing data volume.
- Elastic is developer- and DevOps-friendly, especially for cloud-native environments.
- Modern AI features help speed up root cause analysis.
Cons
- Elastic has a steeper learning curve for new users (We can take of that).
- Self-managed deployments require strong infrastructure expertise.
Comparing Splunk and Elastic Across Key Dimensions
Architecture and Data Ingestion
Splunk relies heavily on its proprietary ingestion and indexing pipeline, which is optimized for performance but less flexible in terms of customization. Elastic, on the other hand, supports a wide range of ingestion methods through Beats, Logstash, and native OpenTelemetry exporters, making it easier to adapt to evolving architectures.
Elastic’s modular ingestion approach gives teams more control over how data is parsed, enriched, and stored, which can be crucial in complex microservices environments.
Querying, Search, and Analytics
Splunk’s Search Processing Language is powerful and expressive, particularly for users already familiar with its syntax. However, it represents another proprietary skill set teams must learn. Elastic uses a JSON-based query DSL and Kibana Query Language, which align more naturally with modern API-driven workflows and developer tooling.
Elastic’s search capabilities are especially strong for exploratory analysis. Engineers can pivot quickly across logs, metrics, and traces, often uncovering patterns that are harder to detect in more rigid systems.
Visualization and User Experience
Splunk offers polished, enterprise-ready dashboards with minimal setup, which appeals to operations teams seeking immediate visibility. Elastic’s dashboards require more initial configuration but offer greater long-term flexibility.
Once customized, Elastic dashboards can be deeply aligned with service architecture and business context. This makes Elastic particularly appealing for organizations practicing site reliability engineering or DevOps, where observability is tightly coupled with development workflows.
Scalability and Performance
Both platforms scale well, but they approach scalability differently. Splunk abstracts much of the scaling complexity, especially in its cloud offering, at the cost of higher licensing fees. Elastic allows fine-grained control over cluster sizing, data tiers, and retention strategies.
Elastic’s approach enables cost-efficient scaling, particularly for long-term data retention and high-ingest workloads. This advantage becomes more pronounced as observability data volumes continue to grow.
Cost and Licensing Considerations
Cost is often the deciding factor between Splunk and Elastic. Splunk’s ingestion-based pricing can be prohibitive for data-intensive observability use cases. Elastic’s licensing, while not free for all features, provides more options to balance cost and capability.
Elastic’s favorability lies in its ability to support extensive observability without forcing teams to limit data collection. This encourages better engineering practices and more comprehensive system understanding.
Final Thoughts
Both Splunk and Elastic are capable of observability platforms, and the right choice depends on organizational priorities. Splunk offers a polished, enterprise-focused experience with minimal setup, while Elastic provides a flexible, scalable, and developer-friendly observability foundation.
As systems become more complex and data volumes increase, the advantages of openness, cost control, and adaptability become increasingly important. In that context, Elastic’s observability stack often emerges as the more future-proof option for teams building and operating modern, cloud-native applications.


