What is OpenTelemetry?

OpenTelemetry (OTel) is an open-source, vendor-neutral framework for generating, collecting and exporting observability data. It gives engineering teams a single standard for capturing metrics, logs and traces without locking instrumentation into one vendor.

Talk to an expert

Open standards. Better data. More choice.

Modern applications span microservices, containers and cloud infrastructure. When every tool uses its own proprietary agent and data format, connecting signals becomes slow and expensive.

OpenTelemetry solves this by standardising how telemetry is created and moved. Yet it is not an observability platform. It simply produces and routes data. Turning that data into reliable alerts and dashboards still requires strong engineering and governance.

One framework for all three telemetry signals

Trust in data

Metrics

How is it performing?

Standardised measurements of latency, error rates and resource usage across services.

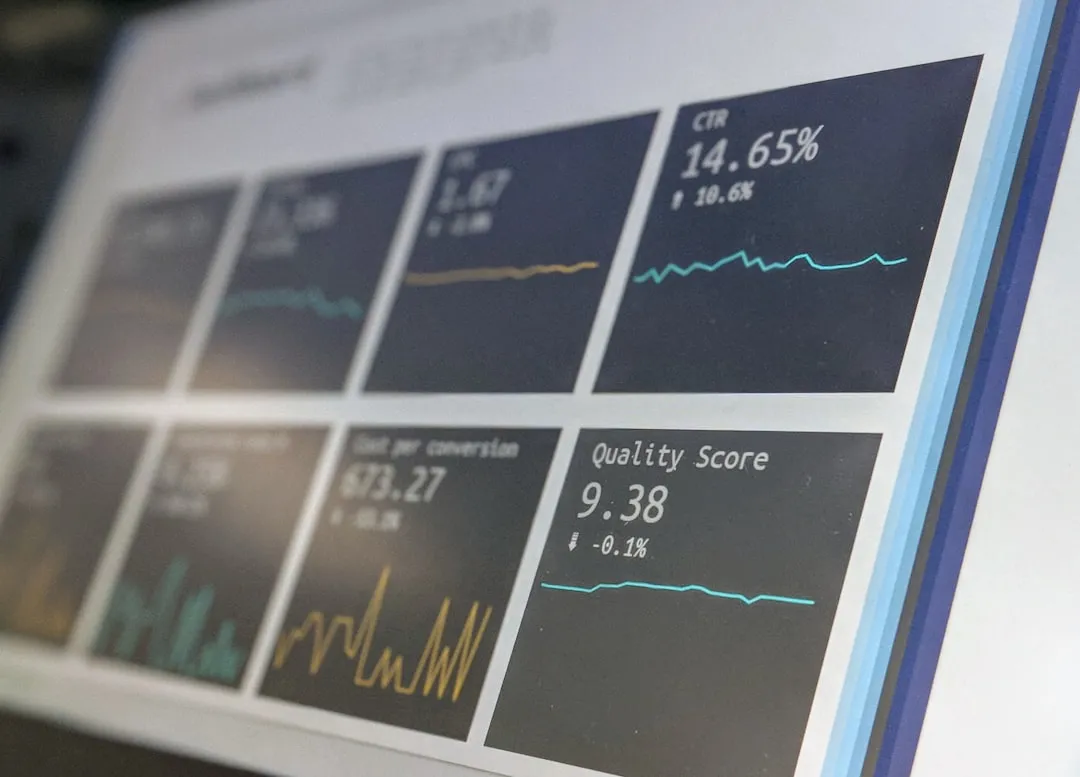
Observability dashboard

Logs

What happened?

Structured event records linked to trace context to tie errors to specific requests.

Data architecture

Traces

Where did it happen?

Distributed request paths that expose bottlenecks and failing dependencies.

From application code to actionable insight

1. Instrument applications

Services generate telemetry using OpenTelemetry APIs, language SDKs or automatic instrumentation. This reduces reliance on proprietary agents.

2. Collect and process

The OpenTelemetry Collector collects telemetry across your stack. It filters noise, masks sensitive fields and enriches metadata in one pipeline.

3. Export and analyse

Processed data exports via the open OTLP protocol to platforms like Elastic. There, it is ready for storage, search, correlation and alerting.

Architectural benefits for growing teams

No vendor lock-in

Instrument your applications once using open standards. You can then route telemetry to your chosen backend without rewriting code.

Consistent cross-system data

Shared semantic conventions standardise how telemetry is structured. Services written in different languages describe hosts, requests and errors the exact same way.

End-to-end distributed tracing

Built-in context propagation tracks every request across service boundaries. It links logs, metrics and traces across complex microservice chains.

Centralised cost and data control

The OpenTelemetry Collector filters telemetry before it leaves your environment. You can sample traces and drop noisy records before ingestion bills grow.

How Elastic works with OpenTelemetry

Elastic is a major contributor to OpenTelemetry, offering native OTLP ingestion alongside dedicated tooling for self-managed and cloud environments:

ECS and OpenTelemetry Semantic Conventions: Elastic contributed the Elastic Common Schema (ECS) to OpenTelemetry to align both models into unified conventions. Because existing Elastic dashboards and security rules may still rely on ECS fields, careful schema mapping keeps legacy and modern pipelines working smoothly together.

Elastic Distributions of OpenTelemetry (EDOT): Elastic provides tested, supported OTel SDKs and Collector components integrated with Elastic Agent for streamlined deployment.

Elastic Self-Managed: Running gateway OpenTelemetry Collectors in front of self-managed Elastic clusters gives you open instrumentation standards with full control over data residency, security and infrastructure.

What it takes to run OpenTelemetry in production

Adopting OpenTelemetry removes proprietary agent lock-in, but operational discipline remains essential:

Data hygiene

Inconsistent service names and missing attributes weaken correlation across services.

Volume and cost control

Collecting every trace span without smart sampling quickly inflates storage bills.

Collector reliability

Gateway Collectors are production infrastructure. They need active monitoring, scaling and upgrades.

Schema alignment

Mixing legacy agents, ECS integrations and OTel pipelines takes clear mapping rules.

Clear ownership

Someone must maintain SDKs, enforce naming rules and refine pipelines over time.

OTel builds the foundation. Your team builds the capability.

Observata helps organisations run OpenTelemetry with Elastic in your own infrastructure. We handle Collector architecture, schema alignment and daily operations while your engineers focus on core software.

Explore our approach

What are logs?

Timestamped event records that detail application activity, errors and system state. Learn how structured logs turn raw data into reliable answers.

Read more about What are logs?

What are metrics?

Numerical measurements of latency, throughput and resource usage. Discover how metrics spot performance shifts before users feel them.

Read more about What are metrics?

What are traces?

Distributed request paths that follow transactions across services and dependencies. See how traces pinpoint where delays and failures happen.

Read more about What are traces?